NBA Usage Rate and Player Props: How Shot Volume Drives Prop Lines
 Available in US

Usage Rate: The Single Number That Predicts Most Prop Lines
If I could only look at one stat before placing an NBA prop bet, it would be usage rate. Not points per game, not the opponent’s defensive ranking, not even the game spread. Usage rate — the percentage of team possessions a player uses while on the court — is the single strongest predictor of where a player’s prop line will land on any given night.
I arrived at this conviction after running a correlation analysis on three seasons of prop outcomes against various input metrics. Usage rate outperformed minutes, recent scoring average, and matchup-based projections as a predictor of points prop results. It also correlated meaningfully with assists and PRA outcomes, because the player who uses the most possessions is typically the player the offence runs through — which means he is either shooting or creating for teammates on a large share of plays.
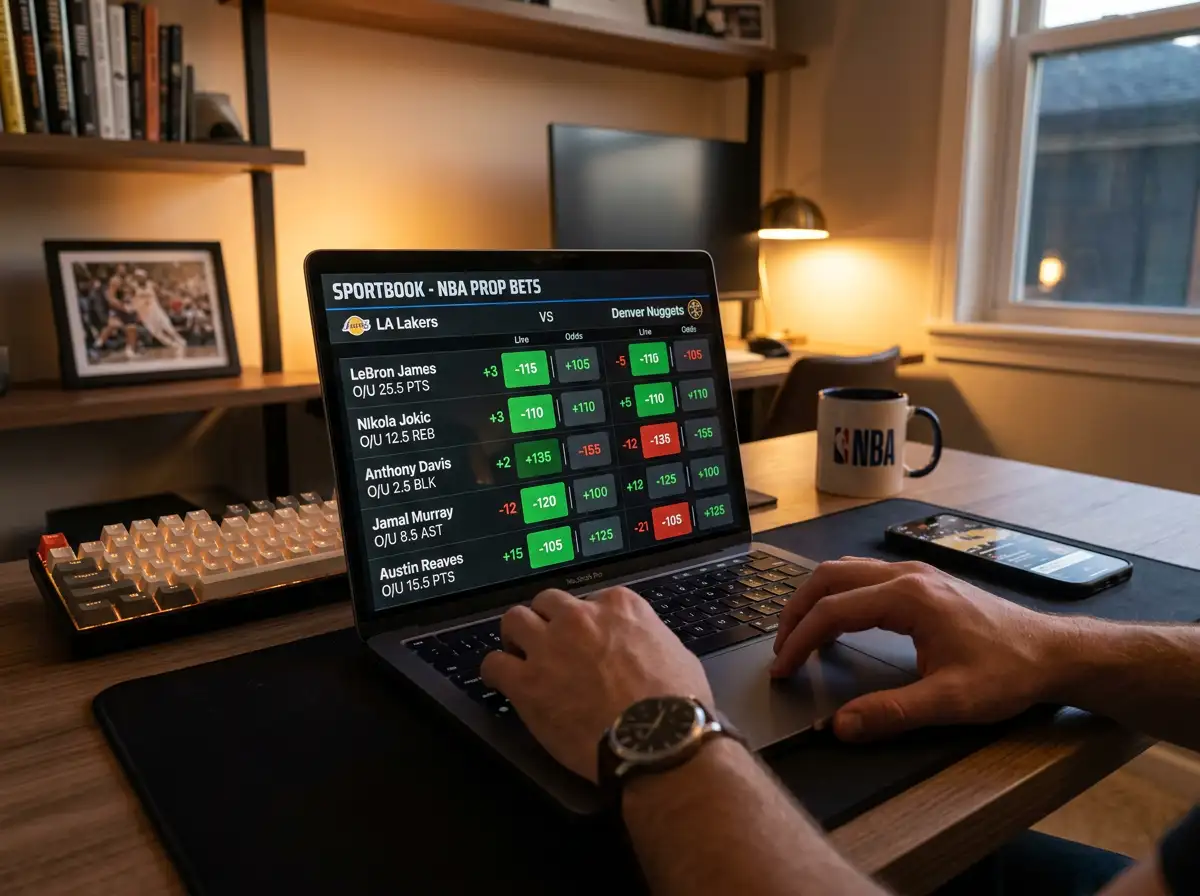
AI-driven prop analysis platforms have latched onto the same insight. Player props represent the fastest-growing betting market in basketball, and the models that perform best — some reporting ROI of 9.87% across thousands of 2025-26 NBA games — lean heavily on usage rate as a foundational input. You do not need to build a machine learning model to benefit from this; you just need to understand what usage rate tells you and how to apply it to the lines on your UK bookmaker’s screen.
What Usage Rate Is and Why Bookmakers Track It
The formula behind usage rate is not complicated, but the concept is counterintuitive at first. Usage rate estimates the percentage of team possessions a player “uses” — meaning he either takes a shot, gets to the free throw line, or turns the ball over — while he is on the court. A player with a 30% usage rate is involved in nearly a third of his team’s offensive outcomes during his minutes. A player at 18% is a complementary piece who defers to others.
The NBA average sits around 20%. Star scorers — the kind of players whose props you are betting on most nights — typically operate between 26% and 34%. That top tier of usage is where the prop lines get interesting, because a player at 32% usage is functionally the engine of his team’s offence. His output depends less on hot shooting nights or defensive lapses and more on sheer volume: he gets enough possessions that regression to the mean works in his favour over any single game.
Bookmakers track usage rate as one of the primary inputs in their prop line models. When a player’s usage jumps — due to a teammate injury, a trade, or a coaching adjustment — the bookmaker’s model adjusts the line upward. When usage drops, the line comes down. The adjustment is usually accurate for well-established stars, but the window of mispricing opens in two scenarios: mid-season role changes that the model has not fully absorbed, and backup players who see temporary usage spikes that are difficult to model because the sample size is small.
I find that the most actionable usage data comes from splits, not season averages. A player’s usage rate with a specific teammate on the court versus off it can differ by 4-5 percentage points. If that teammate is listed as questionable on the injury report, the usage split tells you exactly how much the player’s role — and prop line — should shift.
Applying Usage Rate to Points, Assists, and PRA Props
Let me walk through how I use usage rate in a real analysis, step by step. Say I am looking at a shooting guard with a 28% usage rate, 22.5 points per game, and a points line of 22.5 for tonight’s game. The line matches his season average — looks fair on the surface.
First, I check his usage rate in the last ten games. If it has crept up to 30% due to a teammate missing time, his recent scoring average might be 24.5 — two points above the season number. The bookmaker may have adjusted the line partially, but if the line is still 22.5 while his recent usage and output say 24.5, there is a gap. That gap is the over play.
Second, I check usage rate by lineup. If the team’s starting point guard is healthy, the shooting guard’s usage might be 27%. If the point guard sits, it might jump to 31%. That four-point swing in usage translates to roughly two extra shot attempts per game, which — at league-average efficiency — adds about two points to the expected output. For a 22.5 line, that shift can turn a marginal play into a strong one.
For assists, usage rate works differently. High-usage scorers tend to have lower assist rates because they are ending possessions with shot attempts rather than passes. But a playmaker with high usage and a high assist percentage — meaning he uses possessions primarily by creating for others, not just scoring — is an ideal assists prop target. His usage guarantees he touches the ball on a high share of possessions, and his assist percentage tells you those touches convert into pass-based outcomes rather than shots. That combination produces a stable assists floor that makes the over reliable in favourable matchups.
PRA props benefit from usage analysis because usage is the common thread connecting all three categories. A player with a 30% usage rate, 32 minutes per game, and a versatile skill set will produce a PRA total that is more predictable than any single component. The 2025-26 season’s overall 56.8% win rate on evaluated props improves when you filter for high-usage players in high-pace matchups — the two factors compound, creating an elevated statistical environment that pushes multiple categories upward simultaneously.
The mistake I see most often is using usage rate as a static number. It is not static. It changes game to game based on who else is on the court, and the injury cascade effect is essentially a dramatic, sudden usage shift. When you think of usage rate as a dynamic variable that responds to lineup context, you stop treating prop lines as fixed numbers and start treating them as moving targets that you can track in near real time — and that shift in perspective is what separates profitable prop bettors from everyone else.
What is a good usage rate for an NBA prop bet target?
Players with usage rates above 26% are generally the strongest prop targets because their high volume of possessions creates a more predictable statistical floor. The sweet spot for scoring props is 28-32%, where the player generates enough shot attempts that nightly variance is moderated by sheer volume. Below 22% usage, a player’s output becomes too dependent on game flow and coaching decisions to project reliably for prop purposes.
How does a player’s usage rate change in different lineup combinations?
Usage rate can swing by 4-5 percentage points depending on which teammates are on the court. When a primary scorer or ball handler sits, the remaining players absorb his possessions — and the next-best offensive option typically sees the largest usage bump. NBA tracking sites publish on-off splits that show each player’s usage rate with and without specific teammates, giving you a direct read on how lineup changes affect the prop landscape.
Published by the nba Player Prop bet team.